What is a Cover Letter Infographic
In the competitive world of job applications, standing out from the crowd is crucial. A cover letter infographic is a visually appealing way to present your skills, experience, and qualifications in a concise and engaging format. Unlike traditional cover letters, which rely heavily on text, an infographic uses a combination of visuals, data, and minimal text to capture the reader’s attention and leave a lasting impression. This innovative approach can significantly increase your chances of getting noticed by potential employers and securing an interview. By transforming your cover letter into an infographic, you transform it into a piece of shareable content and a memorable introduction to your professional self. Consider it your personal brand statement, designed to be both informative and visually striking.
Benefits of Using a Cover Letter Infographic
There are several compelling reasons to use a cover letter infographic. First and foremost, it grabs attention. In a world saturated with job applications, a visually appealing infographic immediately stands out from the sea of plain text documents. It’s more likely to be noticed and remembered. Secondly, an infographic allows you to showcase your skills and achievements in a clear and concise manner. By using charts, graphs, and icons, you can quickly convey your accomplishments and quantify your successes. Finally, it makes a memorable impression. Infographics are more shareable and memorable than traditional cover letters. They provide a more engaging and informative experience for the reader, increasing the likelihood they will remember you and your qualifications.
Grabbing Attention

The primary goal of any cover letter is to grab the reader’s attention. A cover letter infographic, with its visual appeal, is ideally suited for this task. The use of color, design, and engaging visuals immediately captures the eye, making it more likely that the hiring manager will spend time reviewing your application. The visual nature of an infographic allows you to present information in a way that is easily digestible and memorable. Instead of overwhelming the reader with lengthy paragraphs, you can use visuals to highlight key achievements, skills, and qualifications. This makes your application more engaging and increases the likelihood that the reader will remember you.
Showcasing Skills and Achievements
A cover letter infographic excels at showcasing your skills and achievements. You can use charts, graphs, and icons to quantify your successes and provide visual evidence of your capabilities. For example, you can use a bar graph to illustrate your sales performance over time or a pie chart to show your proficiency in different software programs. These visuals provide a clear and concise representation of your achievements, making them easily understandable and memorable. By using visuals, you can avoid the monotony of lengthy paragraphs and effectively communicate your qualifications in a compelling and engaging way. Highlighting your skills and achievements visually, ensures that the most important aspects of your resume are instantly recognizable.
Making a Memorable Impression
In the competitive job market, making a memorable impression is essential. A cover letter infographic is more shareable and memorable than a traditional cover letter. The visual nature of an infographic makes it more likely that the hiring manager will remember you and your qualifications. The engaging format and use of visuals make it an interesting piece of content, often leading to a more positive impression. Infographics are also easily shared on social media platforms, which can further increase your visibility and chances of getting noticed. By creating a visually appealing and informative infographic, you can significantly increase your chances of making a lasting impression and securing an interview.
Key Elements of a Successful Cover Letter Infographic

Creating a successful cover letter infographic requires careful planning and execution. Several key elements contribute to its effectiveness. These include a compelling headline, a visually appealing design, the strategic use of data and statistics, and clear and concise information. Each element plays a crucial role in capturing the reader’s attention, showcasing your skills, and making a memorable impression. By focusing on these key elements, you can create an infographic that effectively communicates your qualifications and increases your chances of landing the job.
Compelling Headline
Your headline is the first thing the reader will see, so it must be compelling and attention-grabbing. The headline should immediately communicate the value you offer and entice the reader to explore further. Use strong verbs and concise language to make your headline stand out. Your headline could highlight your key skills, achievements, or the specific role you are applying for. The best headlines are clear, concise, and designed to instantly communicate what makes you unique and why you are a good fit for the job.
Visually Appealing Design
A visually appealing design is critical to the success of your cover letter infographic. Use a clean and modern design with a consistent color scheme and fonts. Ensure that your infographic is well-organized and easy to read. The layout should guide the reader’s eye and make it easy to follow the information. Use high-quality graphics, charts, and icons to illustrate your skills and achievements. Avoid clutter and ensure that the overall design is visually engaging. The goal is to create an infographic that is both informative and aesthetically pleasing, providing a positive and memorable experience for the reader.
Use of Data and Statistics

Data and statistics add credibility and impact to your infographic. Use numbers to quantify your achievements and provide tangible evidence of your skills. For example, you could include statistics on your sales performance, customer satisfaction ratings, or project successes. Present this data in a clear and visually appealing way using charts, graphs, and icons. The use of data and statistics helps to make your claims more convincing and provides a concrete representation of your accomplishments. Ensure that the data you present is relevant to the job you are applying for and clearly demonstrates your value as a candidate.
Clear and Concise Information
Keep the information in your cover letter infographic clear and concise. Avoid using lengthy paragraphs or complex jargon. Use bullet points, short phrases, and visual cues to communicate your key points. The goal is to provide information in a way that is easy to understand and quickly digestible. Make sure that every piece of information included serves a purpose and supports your overall message. Remember that the goal is to highlight your skills, achievements, and qualifications in a way that grabs attention and makes a lasting impression.
Formatting your Cover Letter Infographic
Formatting your cover letter infographic correctly is crucial to ensure it is visually appealing and effectively communicates your message. Choose the right tools, select a suitable template, and invest time in designing your infographic. By following the right formatting practices, you can create a cover letter infographic that not only stands out but also provides a positive and memorable experience for the reader. This will greatly increase your chances of making a strong impression and getting the job.
Choose the Right Tools

Several tools are available for creating cover letter infographics, catering to different skill levels and needs. Canva is an excellent choice for beginners, providing a user-friendly interface and a wide variety of templates and design elements. Piktochart is another popular option, offering a range of customizable templates and visualization tools. Adobe Illustrator and Photoshop are more advanced options, ideal for those with design experience who want complete control over their infographic. Choose the tool that best suits your needs and skill level. Consider features such as ease of use, available templates, customization options, and the ability to export your infographic in a suitable format.
Selecting a Template
Selecting the right template can save you time and effort. Templates provide a pre-designed structure that you can customize with your information. Choose a template that is visually appealing, relevant to your industry, and effectively communicates your message. Consider the layout, color scheme, and the types of visuals used in the template. Ensure that the template is easy to adapt to your specific needs and allows you to highlight your key skills and achievements. Remember, the template is a starting point, and you can customize it to reflect your personal brand and style. Start with a template that complements your skills and goals, then adjust it to best reflect your individual strengths.
Designing Your Infographic
Designing your infographic effectively is key to making it stand out. Pay attention to the overall layout, color scheme, and font choices. Ensure that the design is visually appealing and easy to read. Use a consistent color scheme and font throughout your infographic. Organize the information in a logical and easy-to-follow manner. Use visuals, such as charts, graphs, and icons, to present your information in a clear and engaging way. Balance the use of text and visuals to avoid overwhelming the reader. The design should enhance the message you are trying to convey and provide a positive experience for the reader.
Best Practices for Cover Letter Infographic

To create a successful cover letter infographic, you should follow best practices. Keep the design concise, highlight your achievements, include a clear call to action, and proofread your work carefully. By adhering to these principles, you will greatly increase your chances of making a strong impression and getting the job. These practices ensure that your infographic is both informative and visually appealing, leaving a lasting positive impression on potential employers.
Keep it Concise
Keep your infographic concise. The goal is to provide a clear and concise overview of your skills and qualifications, not to overwhelm the reader with information. Focus on the most important information and avoid unnecessary details. Use bullet points, short phrases, and visual cues to communicate your key points. Aim for a clean and uncluttered design that is easy to read and understand. The reader should be able to quickly grasp your key achievements and the value you bring to the table. Prioritize the information and ensure that every element serves a purpose.
Highlight Achievements
Highlight your key achievements and quantify your successes. Use data and statistics to provide concrete evidence of your skills and abilities. For example, you can include information about your sales performance, project outcomes, or customer satisfaction ratings. Use charts, graphs, and icons to present this data in a clear and visually appealing way. Focus on achievements that are most relevant to the job you are applying for. Highlighting achievements will give the hiring manager a quick overview of your value, demonstrating your potential and making a lasting impression.
Include a Clear Call to Action

Include a clear call to action. Tell the reader what you want them to do next. This could be visiting your website, contacting you for an interview, or reviewing your portfolio. Make the call to action prominent and easy to find. Use clear and concise language to make the call to action stand out. By including a call to action, you guide the reader and encourage them to take the next step. This greatly increases your chances of securing an interview or job offer.
Proofread Carefully
Proofread your infographic carefully before submitting it. Errors in grammar, spelling, or formatting can detract from your professionalism and credibility. Check your work multiple times, and consider having a friend or colleague review it as well. Ensure that all information is accurate and up to date. Correctly proofread, ensures that the infographic conveys your message effectively and makes a positive impression. This attention to detail demonstrates your commitment to quality and enhances your chances of success.
Examples of Effective Cover Letter Infographics
Analyzing examples of effective cover letter infographics is a great way to understand what works and inspire your own design. These examples demonstrate how to effectively present your qualifications in a visually appealing and engaging way. By studying these examples, you can gain insights into layout, design, and content, helping you create a cover letter infographic that stands out. Consider the following examples of successful infographics, noting the design choices and the way each individual’s experience is presented.
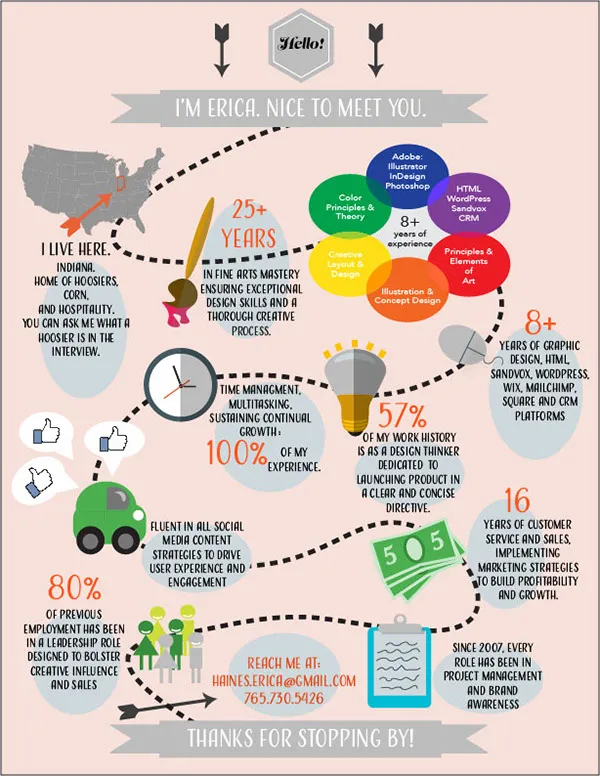
Cover Letter Infographic Example 1

This example utilizes a clean and modern design with a clear layout. It highlights the candidate’s key skills and achievements through the use of icons, charts, and graphs. The color scheme is consistent, making it visually appealing and easy to read. The infographic includes a compelling headline and a clear call to action. The information is concise and presented in a way that is easily digestible and memorable. Overall, this example provides a strong visual overview of the candidate’s qualifications.
Cover Letter Infographic Example 2
This infographic uses a more creative and visually dynamic approach. It incorporates a unique design, with a focus on storytelling to present the candidate’s experience. The infographic showcases the candidate’s key accomplishments through the use of visual elements. The layout is well-organized, and the information is presented in a clear and engaging way. This example illustrates the power of visual storytelling in a cover letter infographic, making it a memorable piece that captures the hiring manager’s attention.
Cover Letter Infographic Example 3
This cover letter infographic focuses on highlighting key skills and showcasing quantifiable achievements. The design is clean, modern, and easy to navigate, making it highly readable. The infographic includes charts and graphs to visually represent data, making the achievements easily understandable and memorable. It offers a concise overview of the candidate’s qualifications, making a strong impression. The layout is simple, the information is clearly presented, and there is a distinct call to action.